Investing in the stock market can be an exciting yet intimidating venture, especially for beginners. Technical analysis plays a vital role in simplifying market trends to help traders make informed choices. One popular tool in technical analysis is a candlestick chart, which visually represents price movements in a specified time frame. Among the numerous candlestick patterns, the morning star candlestick pattern holds a prominent place. If you’re wondering what this pattern means and how it can benefit stakeholders, you’ve come to the right place. Let’s break it down step by step in simple terms.
What Is the Morning Star Candlestick Pattern
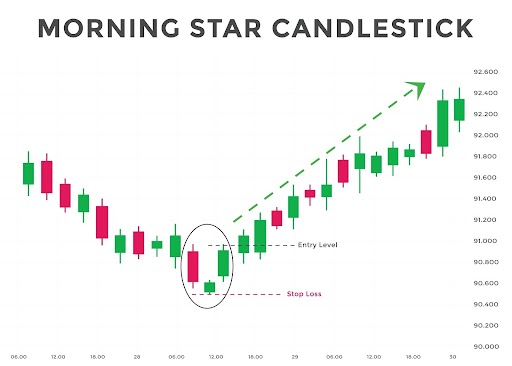
The morning star candlestick pattern is a three-candle formation that signals a potential bullish reversal in the financial market. In plain language, it suggests that the price of an asset, such as a stock or cryptocurrency, might change direction and move upward after a period of decline. Traders and stakeholders often watch for this pattern as it helps determine whether it’s a good time to buy an asset.
The morning star candlestick pattern is typically found at the bottom of a downtrend. It signals that the bearish momentum (downward movement) is losing steam and gives hope for an upward correction. Simply put, it’s a sign that things might start looking better after a gloomy market phase for all stakeholders involved.
How Does the Pattern Look
To identify the morning star candlestick pattern, look for three specific candlesticks on a chart:
- Bearish Candle (Long Red or Black Candle): The first candle reflects strong selling pressure, showing that prices are continuing to fall. It’s typically a long red candle and indicates the dominance of sellers.
- Neutral or Indecision Candle (Small Candle): The second candle represents market indecision or a pause in momentum. It can be green, red, or even a Doji. This small candle signifies uncertainty among stakeholders.
- Bullish Candle (Long Green or White Candle): The third candle signals a strong shift in sentiment, demonstrating rising buying pressure. It closes above the midpoint of the first candle, strengthening the signal.
Conditions for the Morning Star Pattern
Relevant stakeholders need to ensure the following conditions are met when identifying the morning star candlestick pattern:
- The pattern forms at the bottom of a clear downtrend.
- The third candle’s closing price crosses at least halfway above the body of the first candle.
- Volume increases on the third candlestick, confirming the potential reversal for stakeholders.
When these requirements are satisfied, the morning star candlestick pattern becomes a reliable indicator to consider.
What Does It Mean for Stakeholders
The morning star candlestick pattern is incredibly helpful for stakeholders, including traders and investors. Let’s simplify its meaning and significance:
- Indicates Market Reversal: The pattern provides stakeholders with early signals that a bearish trend is about to reverse. This helps minimize potential losses.
- Encourages Decision-Making: The morning star candlestick pattern serves as a guide for your next steps. Stakeholders may move away from selling and start considering buying opportunities.
- Supports Risk Management: Tools like the morning star candlestick pattern help stakeholders manage risks effectively by identifying shifts early to set stop-loss orders.
- Boosts Confidence: Stakeholders who consistently use technical analysis patterns often find themselves more confident when making financial decisions.
- Alignment with Fundamentals: Experienced stakeholders use the pattern in combination with fundamental analysis to validate their predictions.
How to Use the Morning Star Pattern in Trading
Using the morning star candlestick pattern effectively boils down to identifying it accurately. Here’s a simple guide for stakeholders and traders:
- Identify the Trend: The morning star candlestick pattern is most effective when it appears during a clear downtrend.
- Look for All Three Candles: Ensure the formation includes the bearish candle, the indecision candle, and the bullish candle.
- Confirm with Other Indicators: It’s wise for stakeholders to confirm validity using tools like RSI or Moving Averages.
- Set Your Entry Point: Typically, stakeholders enter once the third candle closes above the halfway point of the first candle.
- Position Your Stop-Loss: Place a stop-loss just below the second candle to protect the capital of stakeholders.
Strengths and Limitations of the Morning Star Pattern
Like any technical pattern, the morning star candlestick pattern has its strengths and limitations that stakeholders need to be aware of:
Strengths:
- Simple to spot, even for beginners and new stakeholders.
- Provides early signs for market reversals.
- Works across multiple time frames.
Limitations:
- Not 100% accurate; false signals can occur for stakeholders.
- Requires additional confirmation tools for reliability.
- Can be influenced by external economic uncertainties.
Is the Morning Star Suitable for All Stakeholders
The morning star candlestick pattern is highly versatile and works in a variety of trading environments, making it suitable for most stakeholders. Whether you trade stocks, forex, or cryptocurrencies, this pattern can be applied successfully with practice. For beginners, mastering this pattern expands their toolkit, while for seasoned stakeholders, it adds another layer of insight.
Practical Example of a Morning Star Pattern
Imagine the stock of Company XYZ is declining. You notice the following forming on the chart:
- Day 1: A long red candle, showing strong selling.
- Day 2: A small green candle, indicating indecision among stakeholders.
- Day 3: A long green candle, signaling renewed buying interest.
As a stakeholder observing this, you can conclude that the morning star candlestick pattern is forming. This suggests a potential bullish reversal, giving you the confidence to buy before prices rise further.
Final Thoughts
The morning star candlestick pattern is a powerful and easy-to-use tool to help stakeholders identify potential market reversals. By understanding its structure, stakeholders can better navigate the financial markets. Remember, while the morning star candlestick pattern is a reliable indicator, combining it with other techniques increases accuracy. Stakeholders who approach the market with patience and careful analysis are more likely to succeed.
Freight Forwarding Services in Canada: How Progressive Cargo Simplifies Global Logistics
Freight forwarding plays a crucial role in today’s interconnected global economy. Business…

